
Spectral Discovery for Geostationary Satellite Imagery (e.g. Himawari 8/9 & GOES 16/17)
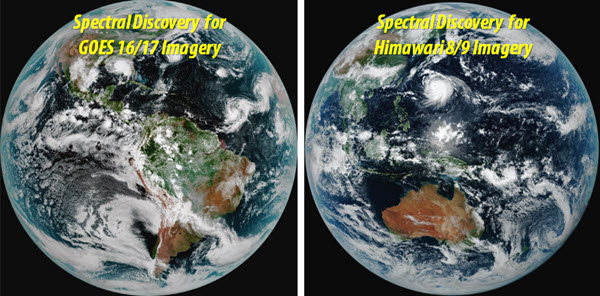 |
Spectral Discovery software has been developed to rapidly process near real-time JMA Himawari 8/9 and NOAA GOES 16/17 imagery. Functions include:
- Simple and convenient band combinations
- Adaptive image stretching
- Advanced image pan-sharpening or image fusion
- Exploratory image feature extraction
Application 1: Tiled Web Maps of Near Real-time Imagery
We prepare and distribute related composite images in XYZ tiles very efficiently (e.g. available every 10 minutes). Access URLs are in the following forms:
- curl https://api.GeoSage.com/goes16/{year}/{month}/{day}/{hhmm}/{tileset}/{z}/{x}/{y}.[jpg | png] -H apikey=[x]
or, with a single URL address:
- https://api.GeoSage.com/h8/{year}/{month}/{day}/{hhmm}/{tileset}/{z}/{x}/{y}.[jpg | png]?&apikey=[x]
Tile maps can be easily integrated with web or mobile mapping applications (those using Google Maps APIs, Leaflet APIs, OpenLayers APIs, Mapbox APIs, etc.), by updating related URLs.
Two examples at specific timestamps:
In the example, web map zoom levels 2-3-4-5 are used; we can extend zoom levels to 6-7-8 if needed (corresponding to ~2.4-1.2-0.6 km spatial resolutions on the ground, respectively).
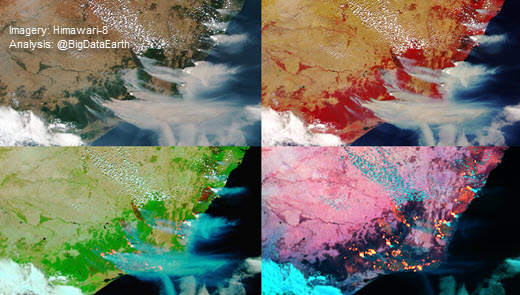
Application 2: Making Composite Images to Highlight Features
Analysing multispectral satellite imagery to highlight different features of interest (e.g. vegetation, fire scar and hotspots)
|
|
Application 3: Making Animations using Near Real-time Imagery
We analyse large-sized satellite imagery and other geospatial datasets to create accurate and scientifically-valid visuals (e.g. maps and animations) enhancing the reporting of major events (e.g. bushfires, flooding and tropical cyclones).
|
|
Example 1: Animation to show rapid fire movement in SE Australia during the 2019-20 Black Summer bushfires (full animation: link)
|
|
Example 2: Animation to show the widespread snowing and massive cold fronts in East Asia on 2020-12-30 (full animation: link)
|
|
Example 3: Animation to show the widespread sandstorm in western Mongolia and northern China on 2021-03-15 (full animation: link)
|
|
Example 4: Full-disk view on 2021-03-15. Daily images or animations for your region of interest are available upon request.
|
|
Example 5: Animation to show heavy storms in eastern Australia on 2020-12-12 (full animation: link)
|
|
Example 6: Animation to show atmospheric dynamics over the Australian continent on 2020-12-01 (full animation: link). Daily images or animations for your region of interest are available upon request.