
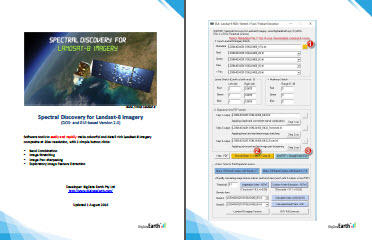
Spectral Discovery for Landsat-8 Imagery
 |
Advanced image
stretching and pan-sharpening software to easily and rapidly make colourful and detail-rich (15m-resolution) Landsat-8 imagery composite, with 3 simple button clicks
- Popular software for geospatial professionals and general users. It is productive and saves time!
- Functions include band combinations, image stretching, image pan-sharpening, and exploratory image feature extraction. Perfect software tool to get the daily fresh Landsat-8 imagery into GIS and remote sensing software, and Google Earth Pro.
- 03/2020: Version 3.1 released
- 01/2021: Support of Landsat Collection 2 - Level 1 data (Collection 2 - Level 2 data is not supported as it does not contain panchromatic band, Band 8)
- Recent features
- 1 button click for automated NDVI calculation, with 3 types of outputs (demo)
- 1 button click for automated extraction of surface water areas, with 3 types of outputs (demo)
- batch processing
- supporting the Landsat-8 data (in compressed GeoTIFF format) downloaded from AWS S3 Landsat-8 portal.
- multiple common band combination options included
- The same software can be used to process the latest Landsat-9 imagery
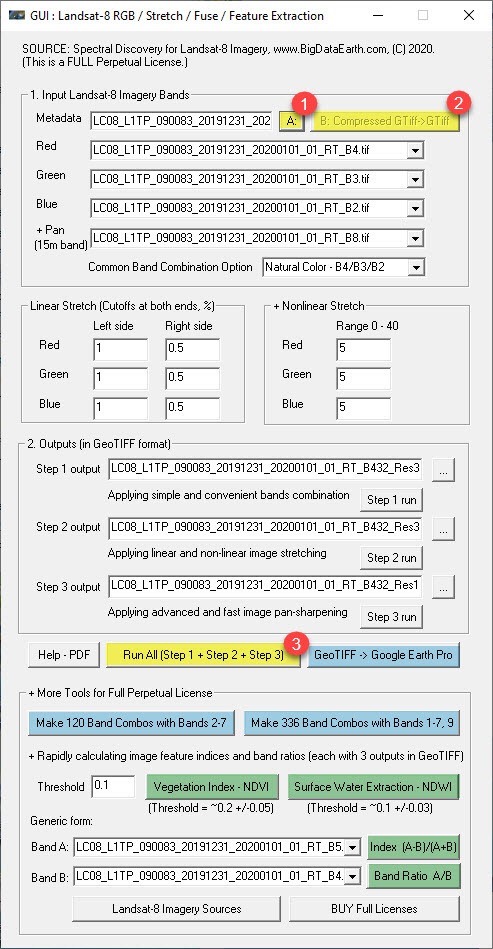
Run software (with 3 button clicks)
|
|
|
Landsat-8 Image Sources
The U.S. Geological Survey (USGS) distributes daily Landsat-8 data in three very accessible ways:
- Search and bulk-download data - EarthExplorer - http://earthexplorer.usgs.gov useful tutorial
- Browse and download data - GloVis - http://glovis.usgs.gov demo
- View and get colour images - LandsatLook Viewer - http://landsatlook.usgs.gov
Recently, there are many other options to download Landsat-8 data. The most convenient way is probably via Amazon Web Services and Google Earth Engine.
- Landsat-8 on AWS: public bucket landsat-pds
https://registry.opendata.aws/landsat-8/
The use of GUI-based tools (e.g. S3 Browser) or AWS Command Line Interface can make data download very quickly and efficiently. Please refer to our similar instruction for Sentinel-2 imagery about this (link).
- Landsat-8 imagery on Google Earth Engine and Google Cloud Platform https://cloud.google.com/storage/docs/public-datasets/landsat
EarthExplorer and GloVis provide Landsat-8 imagery data (all in uncompressed GeoTIFF format typically included in a single / bundled zip file), which can be directly analysed by Spectral Discovery software. For the Landsat-8 Collection 1 Level-1 standard data product, a pixel is commonly represented by a Digital Number, not the true reflectance of land surface.
The Landsat-8 data from AWS S3 or other sources may be in compressed GeoTIFF format. Spectral Discovery software uses the tool (gdal_translate.exe) included in open GIS software QGIS to make format conversion before analysis.
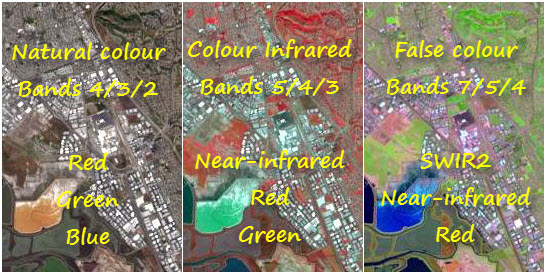
The USGS Landsat portal provides comprehensive FAQs in relation to the new Landsat-8 imagery and its comparison with the previous Landsat series. It is important to read these before conducting proper image processing. Landsat-8 products are delivered as 16-bit images with the panchromatic band at 15m resolution and multispectral bands at 30m resolution, and band combinations are unique (e.g. bands 4/3/2 refer to red/green/blue, respectively, useful for making natural colour composite).
An overview of some common band combinations for better discrimination of various ground features is provided here, but one should not be limited by given prescriptions.
 |
New Image Analysis Software Tools
While the satellite imagery source is magnificent, more work needs to be progressed on how to use the imagery in a straightforward way.
There are many remote sensing and image processing software tools on the market, but it is fair to say that very few can efficiently make beautiful, detail-rich imagery composites with adaptive image histogram stretching and advanced image pan-sharpening. One may spend hours to produce something that is of high quality.
For many GIS users, it is often hard to find right capable tools (i.e. band combination, image stretching and image pan-sharpening) in GIS software packages.
And for casual users and the general public, powerful tools to quickly process the Landsat imagery are lacking.
Spectral Discovery
for Landsat-8 Imagery fill in this gap.
Standalone software tools perform a few critical steps of analyses:
- Step 1 - Band combination (to make three-band imagery composite)
- Step 2 - Image histogram stretching (to make colourful composite)
- Step 3 - Image pan-sharpening (to make colourful and spatially sharper composite)
- Step 4 - Exploratory image feature extraction with image feature indices (e.g. NDVI and NDWI) and band ratios
We believe
these tools are very useful for a wide range of
users who are interested in analysing the latest Landsat-8
imagery. These powerful and easy-to-use tools specifically
target Landsat-8 imagery in GeoTIFF format.
Step 1: Simple
and convenient band combination to make three-band
imagery composite
Landsat8_RGB.exe
<red_band_in> <green_band_in>
<blue_band_in> <RGB_out.tif>
e.g.
Landsat8_RGB.exe b4.tif b3.tif b2.tif RGB_b432.tif
(for true colour)
e.g.
Landsat8_RGB.exe b5.tif b4.tif b3.tif CIR_b543.tif
(for colour infrared)
e.g.
Landsat8_RGB.exe b7.tif b5.tif b3.tif FC_b753.tif
(for false colour)
Step 2: Adaptive
linear and non-linear image histogram stretching over the
three-band imagery composite
Landsat8_Stretch.exe
<red_band_order>
<green_band_order> <blue_band_order>
-s
<image_stretch_band1_left_cut>
<image_stretch_band1_right_cut>
<image_stretch_band2_left_cut>
<image_stretch_band2_right_cut>
<image_stretch_band3_left_cut>
<image_stretch_band3_right_cut>
<nonlinear_stretch_band1>
<nonlinear_stretch_band2>
<nonlinear_stretch_band3>
<RGB_in.tif> <RGB_stretched_out.tif>
e.g.
Landsat8_Stretch.exe 1 2 3 -s 2 0.2 2 0.2 2 0.2 2
2 2
RGB_b432.tif RGB_b432_stretched_res30m.tif
e.g.
Landsat8_Stretch.exe 1 2 3 -s 2 0.2 2 0.2 2 0.2 0
0 0
RGB_b432.tif RGB_b432_stretched_res30m.tif
e.g.
Landsat8_Stretch.exe 1 2 3 -s 0 0 0 0 0 0 0
0 0
RGB_b432.tif RGB_b432_stretched_res30m.tif
Step 3: Advanced and fast image pan-sharpening
Landsat8_Fuse.exe
<pan-sharpening_method> -s
<image_stretch_band1_left_cut>
<image_stretch_band1_right_cut>
<image_stretch_band2_left_cut>
<image_stretch_band2_right_cut>
<image_stretch_band3_left_cut>
<image_stretch_band3_right_cut>
<nonlinear_stretch_band1>
<nonlinear_stretch_band2>
<nonlinear_stretch_band3>
<pan_band_in.tif> <ms_in.tif>
<fused_out.tif>
e.g.
Landsat8_Fuse.exe 1 -s 2 0.2 2 0.2 2 0.2 2 2 2
b8.tif RGB_b432.tif RGB_b432_fused_res15m.tif
Step 4: Calculating image feature indices and band ratios
Landsat8_Feature.exe
<calculation_method> <input_band1.tif> <input_band2.tif> <threshold>
e.g. Landsat8_Feature.exe 1 b3.tif b6.tif 0.1
Details about the options of the tools can be found in the software User Guide (PDF):
|
|
 |
Tips:
- For a scene with little cloud cover or fewer white objects, these image stretching options (-s 2 0.2 2 0.2 2 0.2 5 5 5) would suffice. If a scene contains a large proportion of white objects (e.g. cloud and snow), try to increase the right-end cut-off values in image histogram stretching for their exclusion.
- To improve the brightness of the imagery composite, one may increase non-linear stretching values to 10, 20, 30 and so on.
- The first pan-sharpening method (1) would perform better for the majority of cases. This choice may be subject to the size of image objects in the scene (i.e. ground features).
- Output files from image stretching and pan-sharpening, if exist, will be over-written automatically.
- The same procedure equally works for any three-band combinations. Through iterations, any number of multispectral bands can be fused or pan-sharpened.
- To avoid typing long file names in DOS console, one can simply drag files to the console.
- One may prepare DOS batch files to efficiently run tools with various image stretching and pan-sharpening options.
- The band combinations and image stretching tools may be used to process the generic 8- or 16-bit remote sensing imagery.
Run time:
- Step 1 (band combination): 1-5 seconds
- Step 2 (image stretching): 3-15 seconds
- Step 3 (image pan-sharpening): 15-60 seconds
Notes:
It is with great privilege that we all have access to
such a superior imagery source. We are very motivated and
have tried our best to develop the software tools that can
preserve that high quality as much as possible.
We are confident that anyone even with little image
processing experience can perform the above analysis.
It is our hope that more people can take advantage of
and benefit from the excellent Landsat-8 imagery. Thank you, NASA and the USGS!
Rapid Processing for Innovative Applications
This unique software can be useful for a wide range of environmental studies, including:
- Monitoring land cover changes (e.g. deforestation and urban expansion)
- Mining exploration and mineral detection with SWIR bands
- Precision agriculture and vegetation mapping (e.g. NDVI)
- Natural hazards (e.g. fire scar mapping, flooding, volcanic eruption)
- Updating GIS basemaps with the latest fresh imagery
Two more button clicks: To rapidly make 120 or 336 band combinations using Landsat-8's full spectral bands in a batch mode:
- 120 = 6x5x4, using 6 multispectral bands - Bands 2, 3, 4, 5, 6, 7 (~20GB disk space required for each scene)
- 336 = 8x7x6, using 8 multispectral bands - Bands 1, 2, 3, 4, 5, 6, 7, 9 (~60GB disk space required for each scene)
A simple yet extremely powerful way of image (visual) analysis: Through rapid, various band combinations, important features/phenomena of interest on Earth land surface can be better highlighted and revealed.
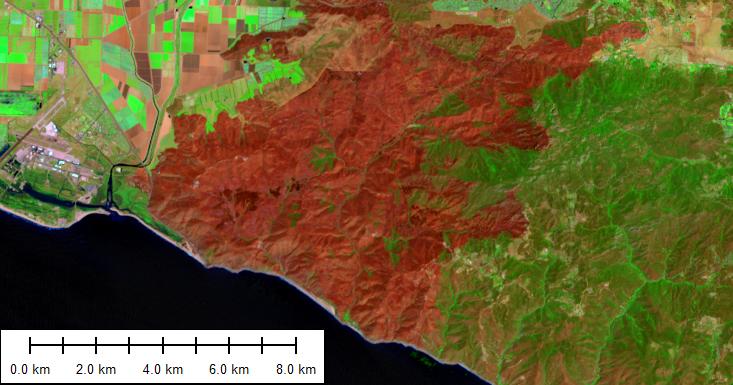
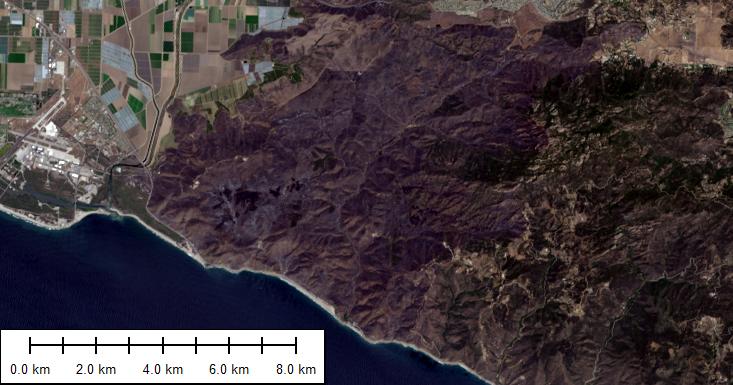
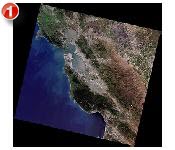
Example 1: Mapping fire scars (burnt areas) with numerous band combinations in an automated procedure. Left: The extent of fire scars being clearly revealed by Bands 7/5/3; Right: Natural-colour image with Bands 5/4/3. Location: Point Mugu State Park, California.
Example 2: Animated view of 336 band combinations (=8x7x6) of a full Landsat-8 scene (using 8 bands)
See the Detail: Advanced Image Fusion and Pan-sharpening
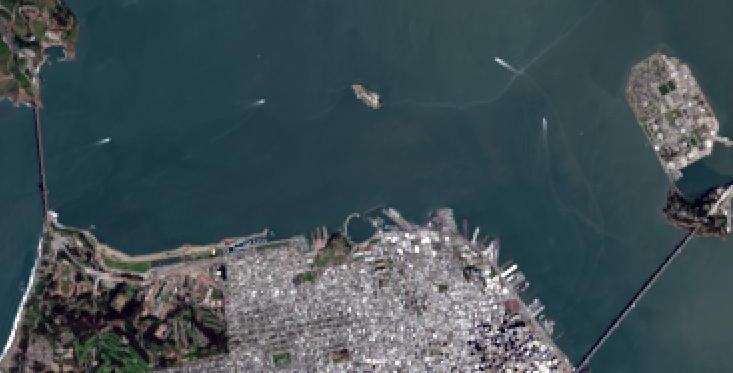
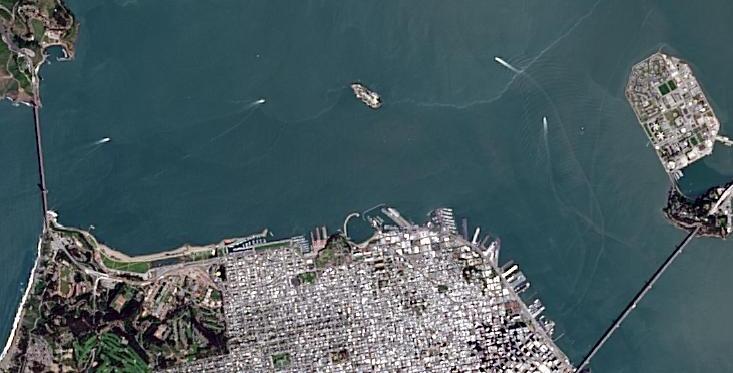
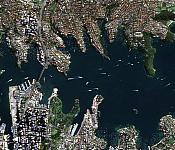
Example 3: Pan-sharpening of Landsat-8 imagery from coarse 30m-resolution (Left) to very sharp 15m-resolution (Right). Location: San Francisco.
See the Invisible: Exploring Unique Short-wave Infrared Bands
Landsat-8 short-wave infrared (SWIR) bands are capable of detecting wildfire hot spots and lava flows/heat through smoke.
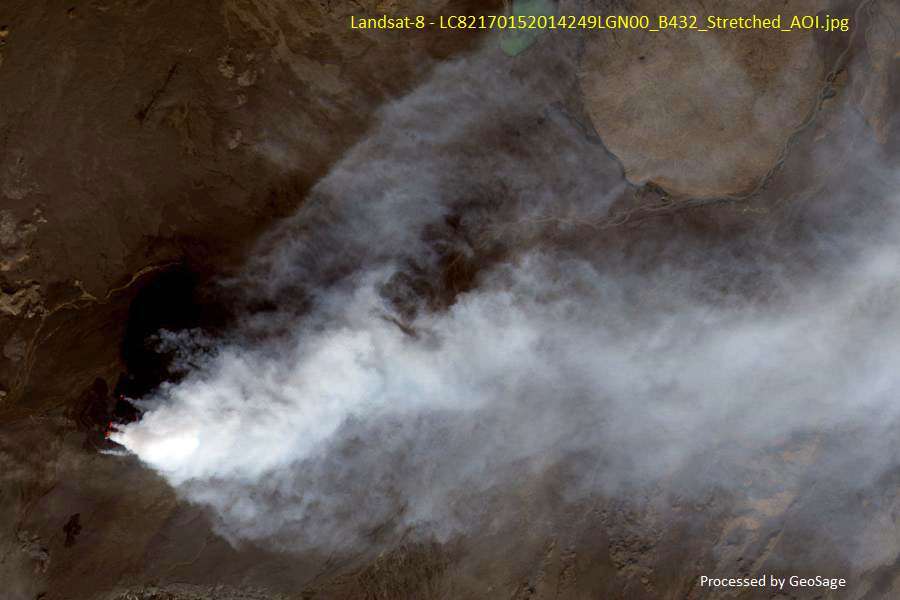
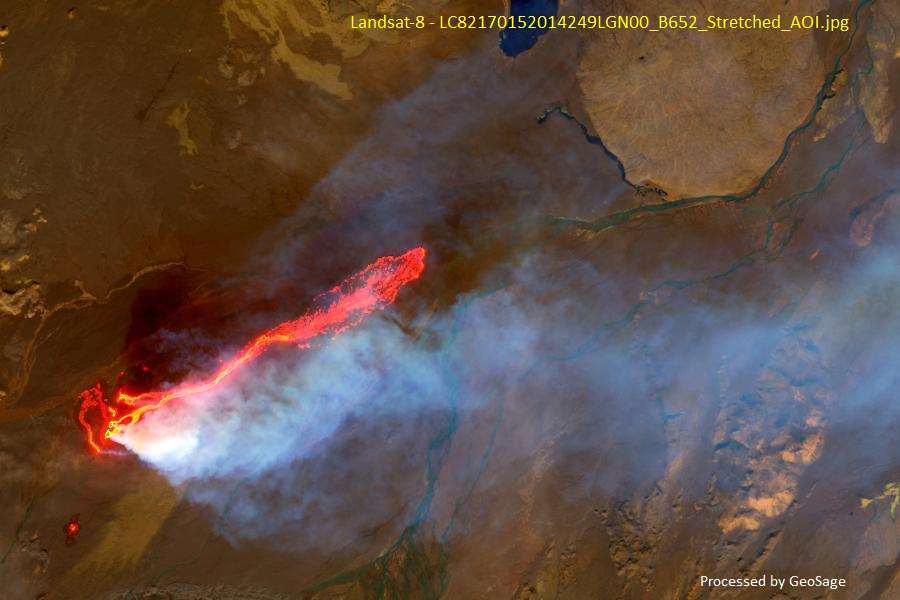
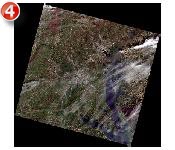
Example 4: Holuhraun Lava Field, Iceland. Left: Natural-colour composite (showing full smoke); Right: false-colour composite (containing SWIR bands)
See Features of Interest (FOI): From Pixels to Information
Exploratory image feature extraction with image indices (e.g. Normalised Difference Vegetation Index - NDVI, Normalised Difference Water Index - NDWI, Normalised Difference Urban Index, Normalised Difference Snow Index, Burned Area Index) and various band ratios, for a wide range of environmental studies.
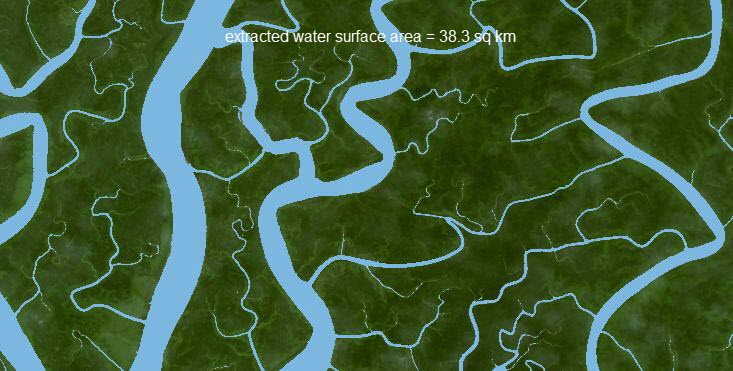
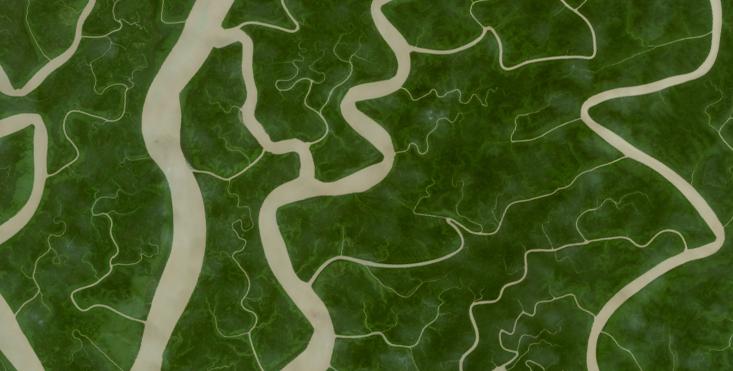
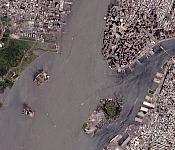
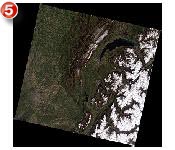
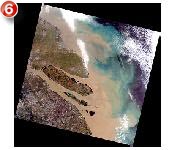
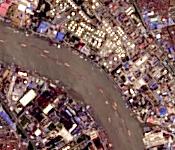
Example 5: Classifying and estimating water surface areas in an automated procedure. Left: Extracted water surface shown in light blue; Right: Natural-colour image with RGB bands. Location: Sundarban, Bangladesh.
See the Big Picture: Using Global Imagery Mosaics
Need a global satellite
imagery mosaic? Please take a look at the high-quality global satellite
imagery mosaics (30m-resolution, multiple styles) in ELS2000 series.
Automated, exploratory land cover classifications at 30m and 15m resolutions, at the global scale (ongoing)
Land cover changes
Near real-time / daily monitoring
...
Others: Processed Samples
Truly natural-colour, full-scene examples for the "Vivid Earth" series - To view our land more clearly and colourfully!
 |
Full scene overview
|
Comparison
and evaluation |
Full-scene, pan-sharpened result at 15m resolution in GeoTIFF, ready to be used in all GIS and mapping software (e.g. QGIS, ArcGIS, MapInfo), popular image-editing software (e.g. PhotoShop), and Google Earth Pro. |
 |
 San Francisco San Francisco |
LANDSAT_SCENE_ID = "LC80440342013106LGN00" stretching option: -s 2 0.2 2 0.2 2 0.2 5 5 5 |
 |
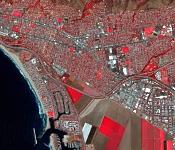
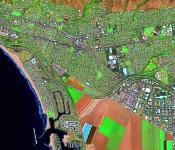
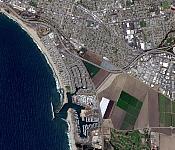 Los Angeles Los Angeles |
LANDSAT_SCENE_ID = "LC80410362013133LGN01" stretching option: -s 2 0.2 2 0.2 2 0.2 5 5 5 |
 |
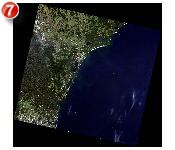
 New York New York |
LANDSAT_SCENE_ID = "LC80140322013152LGN00" stretching option: -s 2 0.2 2 0.2 2 0.2 20 20 20 |
 |
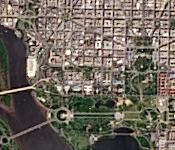 Washington D.C. Washington D.C. |
|
 |
 The Alps, Europe The Alps, Europe |
LANDSAT_SCENE_ID = "LC81960282013115LGN01" stretching option: -s 2 2 2 2 2 2 20 20 20 |
 |
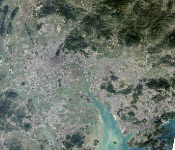
 Shanghai, China Shanghai, China |
LANDSAT_SCENE_ID = "LC81180382013145LGN00" stretching option: -s 2 5 2 5 2 5 5 5 5 |
 |
 |
LANDSAT_SCENE_ID =
"LC80890832013117LGN01" |
 |
 |
|
 |
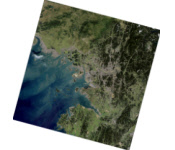
Hong Kong and the Pearl River Delta, China |
|
 |
Seoul, South Korea |
|
It only takes about 1 minute to process each full scene on an ordinary computer. All daily scenes can be processed as above and efficiently delivered as soon as they are available in the following formats (for professionals in remote sensing and GIS fields, as well as the general public):
- Conventional GeoTIFF
- JPEG2000
- KMZ (Google Earth)
- Various web mapping
tilesets, e.g. Google Map Tiles, Bing Maps Tiles,
OSM Tiles, TMS Tiles
the potential for the broadest use of the new
Landsat-8 imagery is great.
"An enormous amount of spatial data sets has been produced and explored already, but the future for a bright, sustained geospatial industry and location intelligence business critically depends on the quality of spatial data."